The $20k test · 4.1
The zone on the chart: nine pictures of the rule
Real sessions from the five-year record, the three lines I draw before the open, and every signal marked taken or skipped with its result.
These are not hand-picked winners. They come straight out of the backtest's trade log, drawn on 5-minute candles. On every chart the dark line is yesterday's close, the shaded strip is the balance zone around it, and the thin blue lines are the outer band. Triangles are entries, red is the stop, green is the target, the x is the exit. Blue signals are the ones the rule takes. Orange signals are the ones it skips.
The setups themselves are the ones I already trade: a turn at a level on the 15-minute chart, stop just past the bar, target at the next level. The rule only decides when they are allowed.
1. Taken, with the move
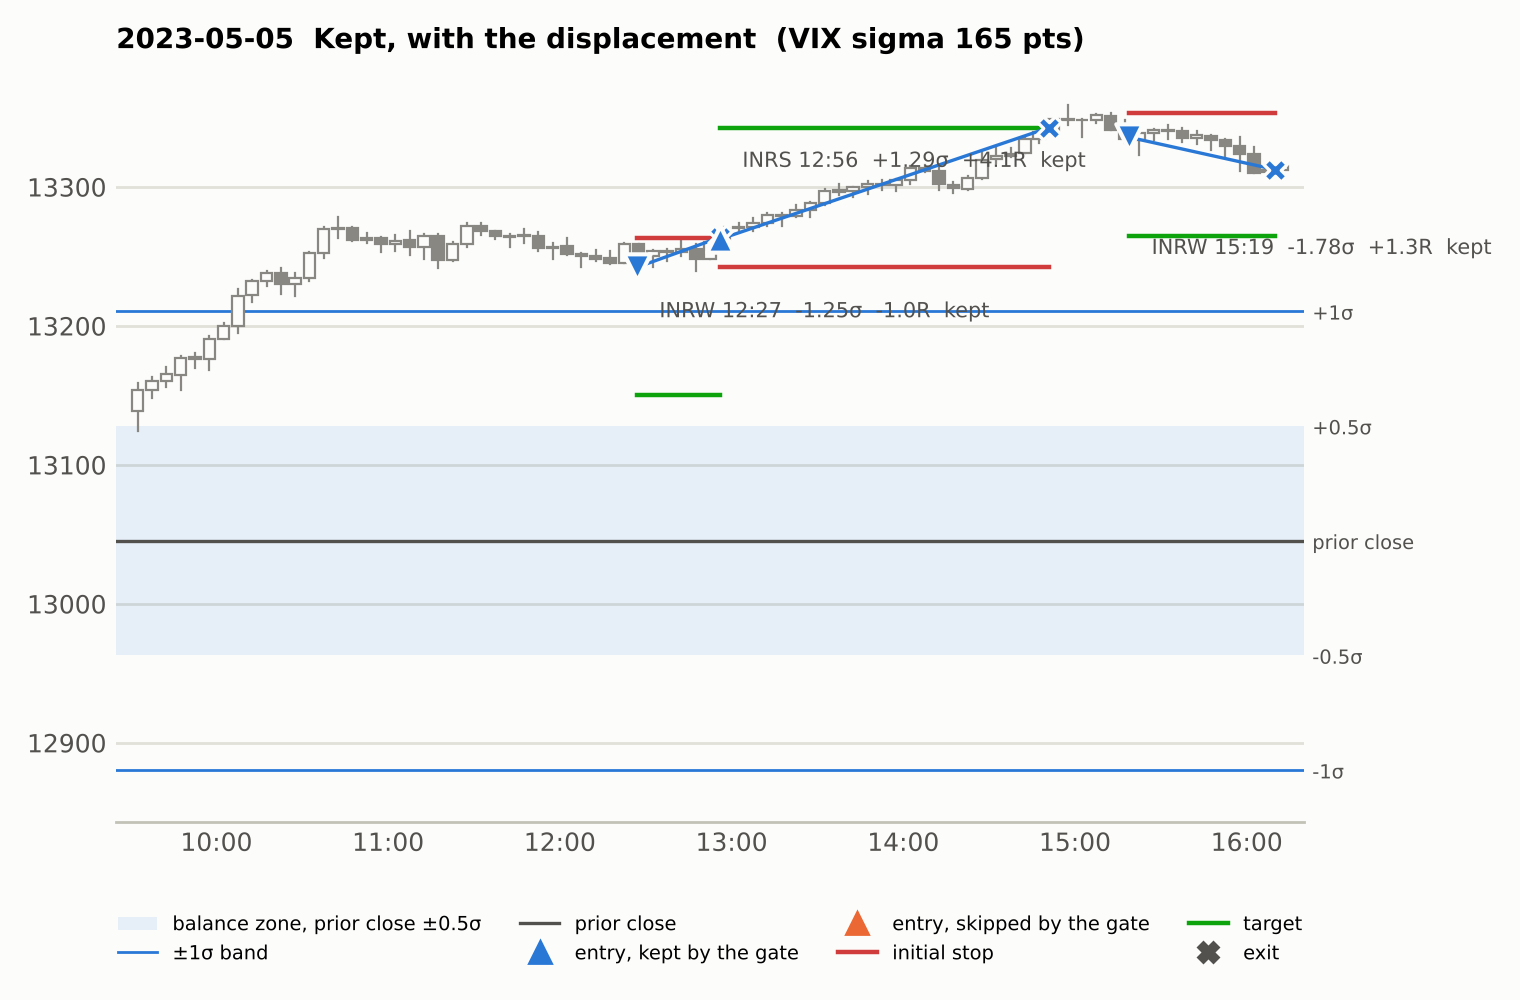
May 5, 2023. The market opened above yesterday's close and was through the outer band by 10:30. The long at 12:56 fired a full band above the close, far outside the zone. It ran to its target for +4.1R. The two shorts that day were also outside the zone and also taken: one lost 1R, one made +1.3R.
2. Taken, with the move, short side
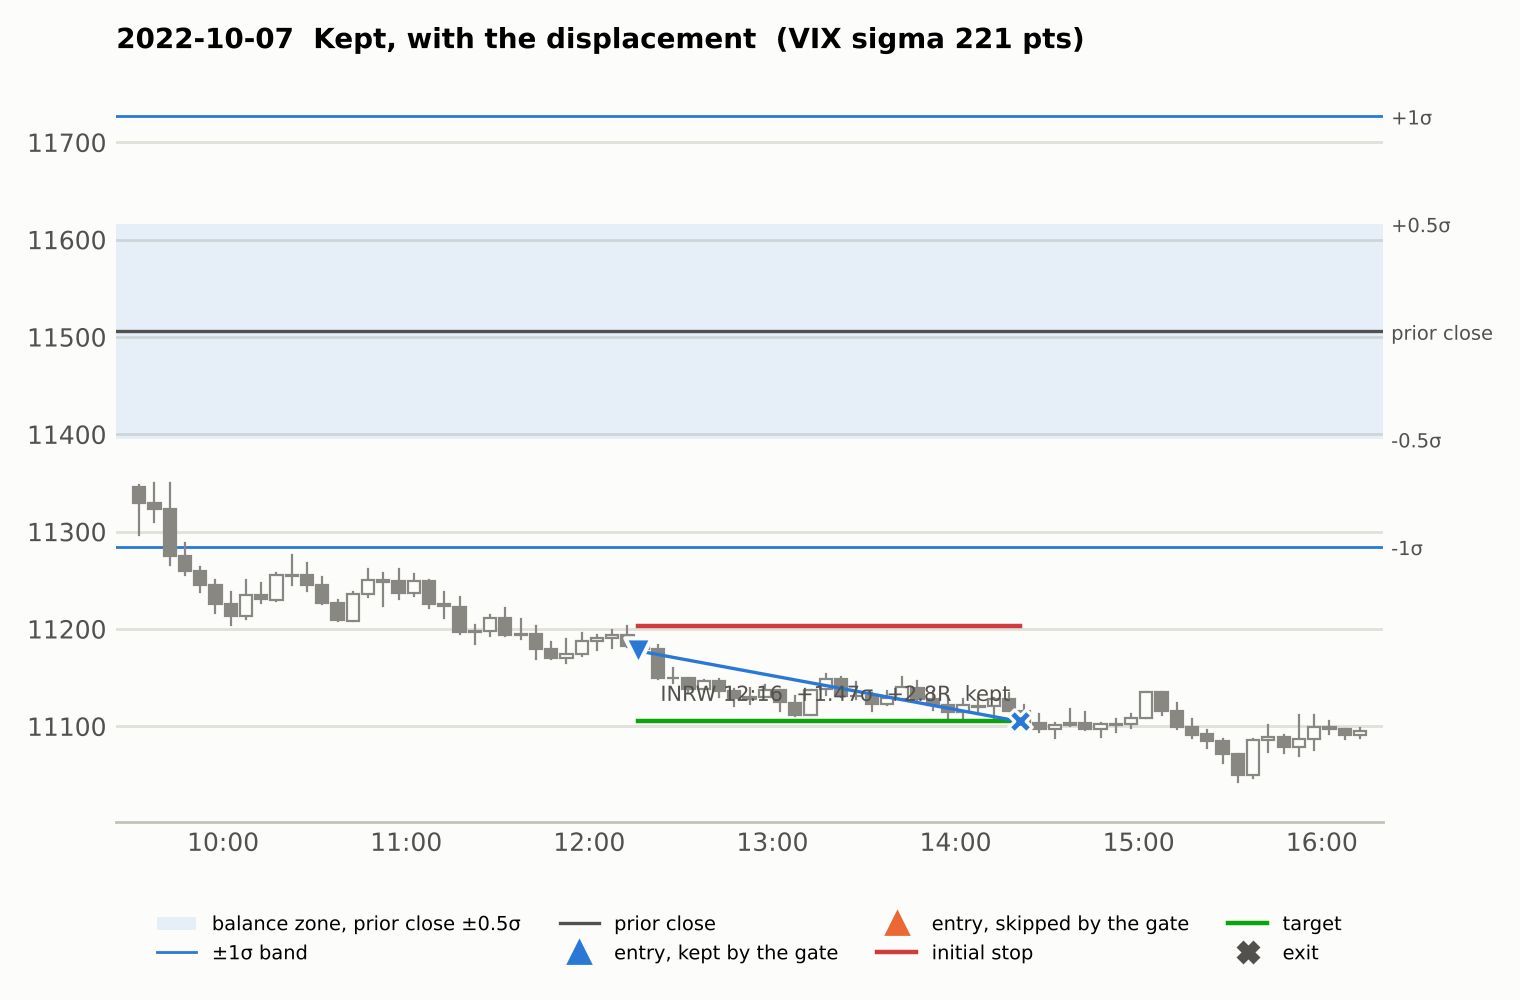
October 7, 2022, a jobs-report day in a bear market. Price gapped below the outer band at the open and never came back. The short at 12:16 was kept and hit its target for +2.8R. Look at the size of the stop on a day like this, 60 to 75 points. This is where one NQ risks about $1,300 and one MNQ about $130.
3. Taken, against the move
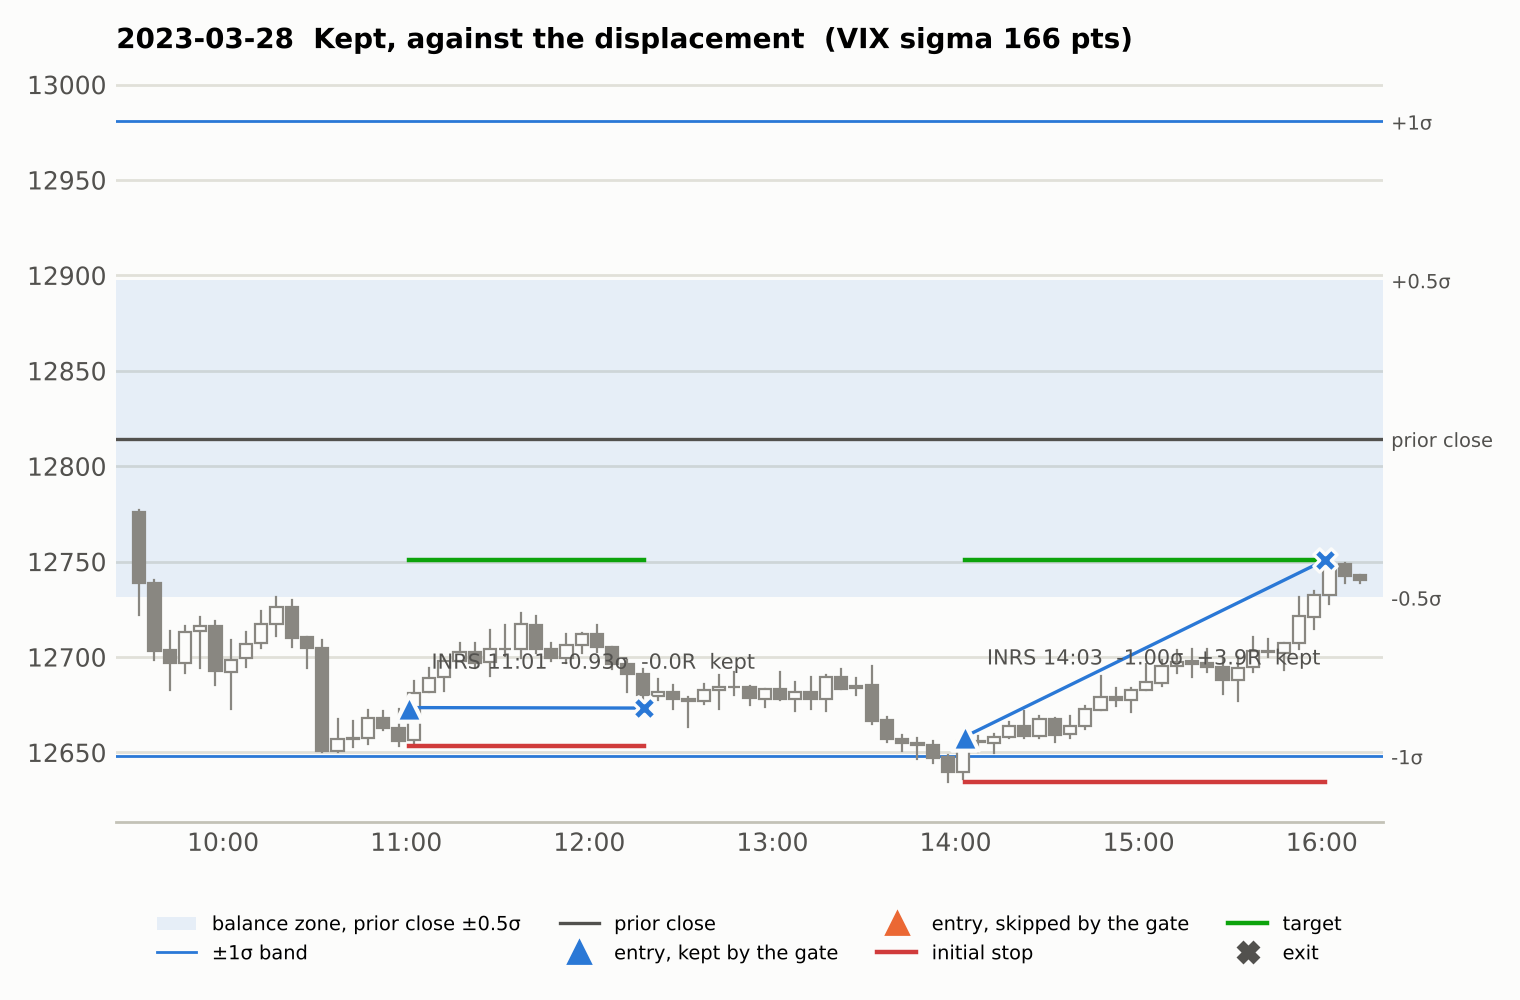
March 28, 2023. Price spent the whole day a full band below yesterday's close. Two longs fired against that at a support level, both outside the zone, both taken. The first scratched. The second reclaimed the level and ran +3.9R into the close. This is why the rule is two-sided and not a trend rule. A turn at an extreme is a real trade. The same turn in the middle is not.
4. Skipped: a balance day
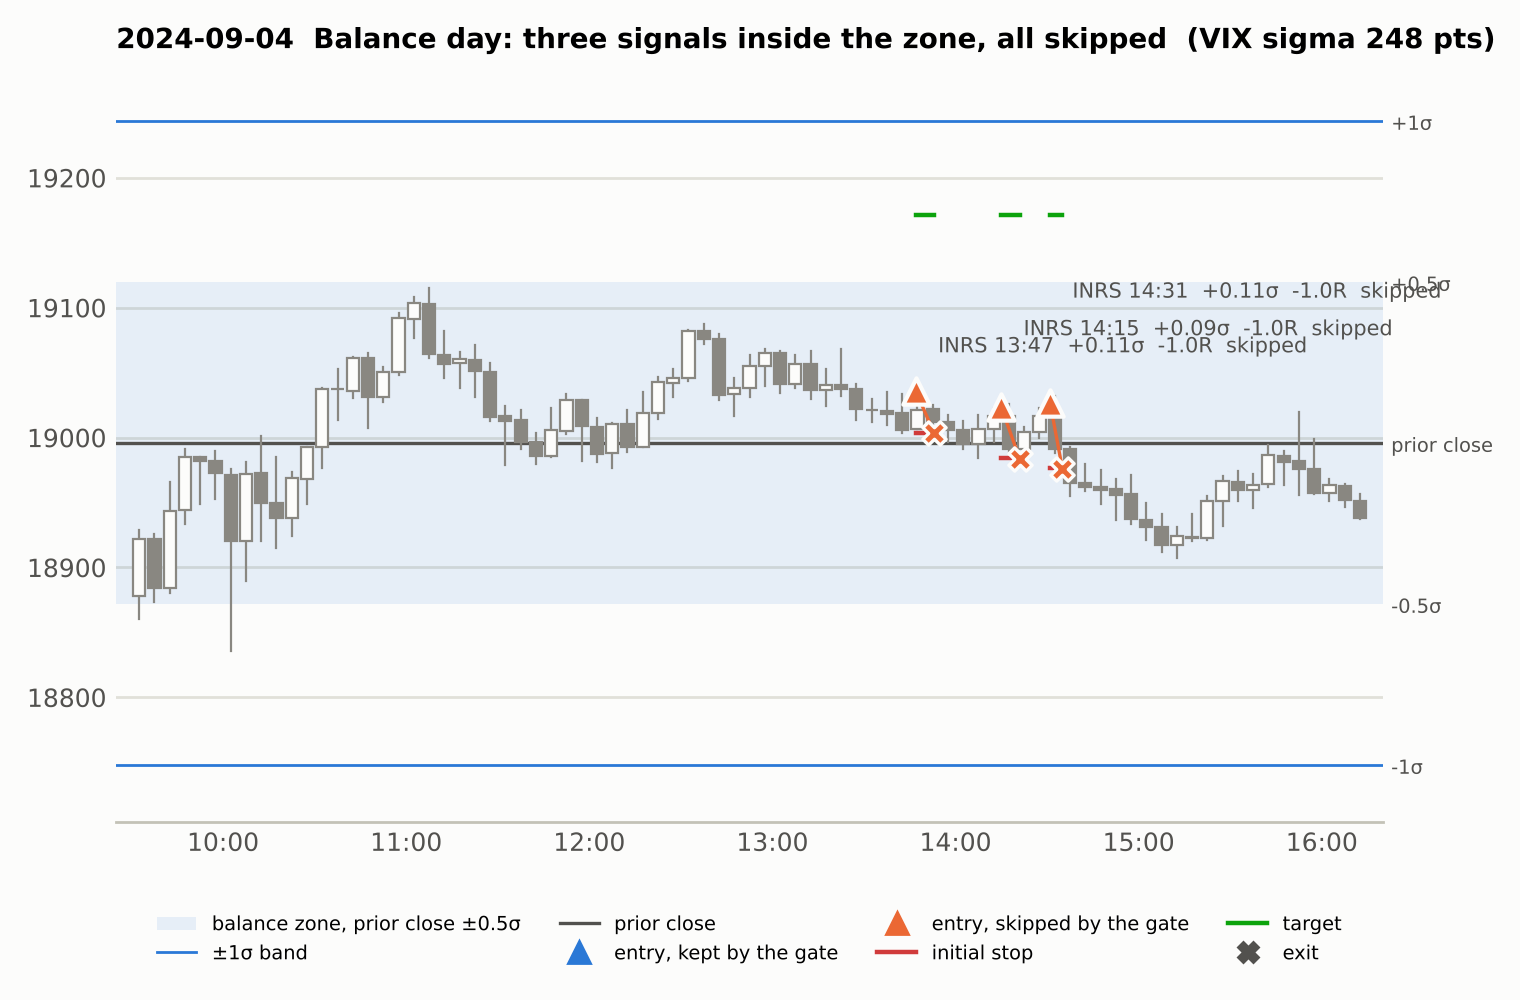
September 4, 2024. Price never left the zone. Three longs fired within 45 minutes of each other, each within a hair of yesterday's close, each stopped out for 1R. Minus 3R on the day. The rule skips all three. This is the typical losing day for my setups, and over five years the 425 entries inside the zone averaged minus 0.16R each.
5. Taken and lost
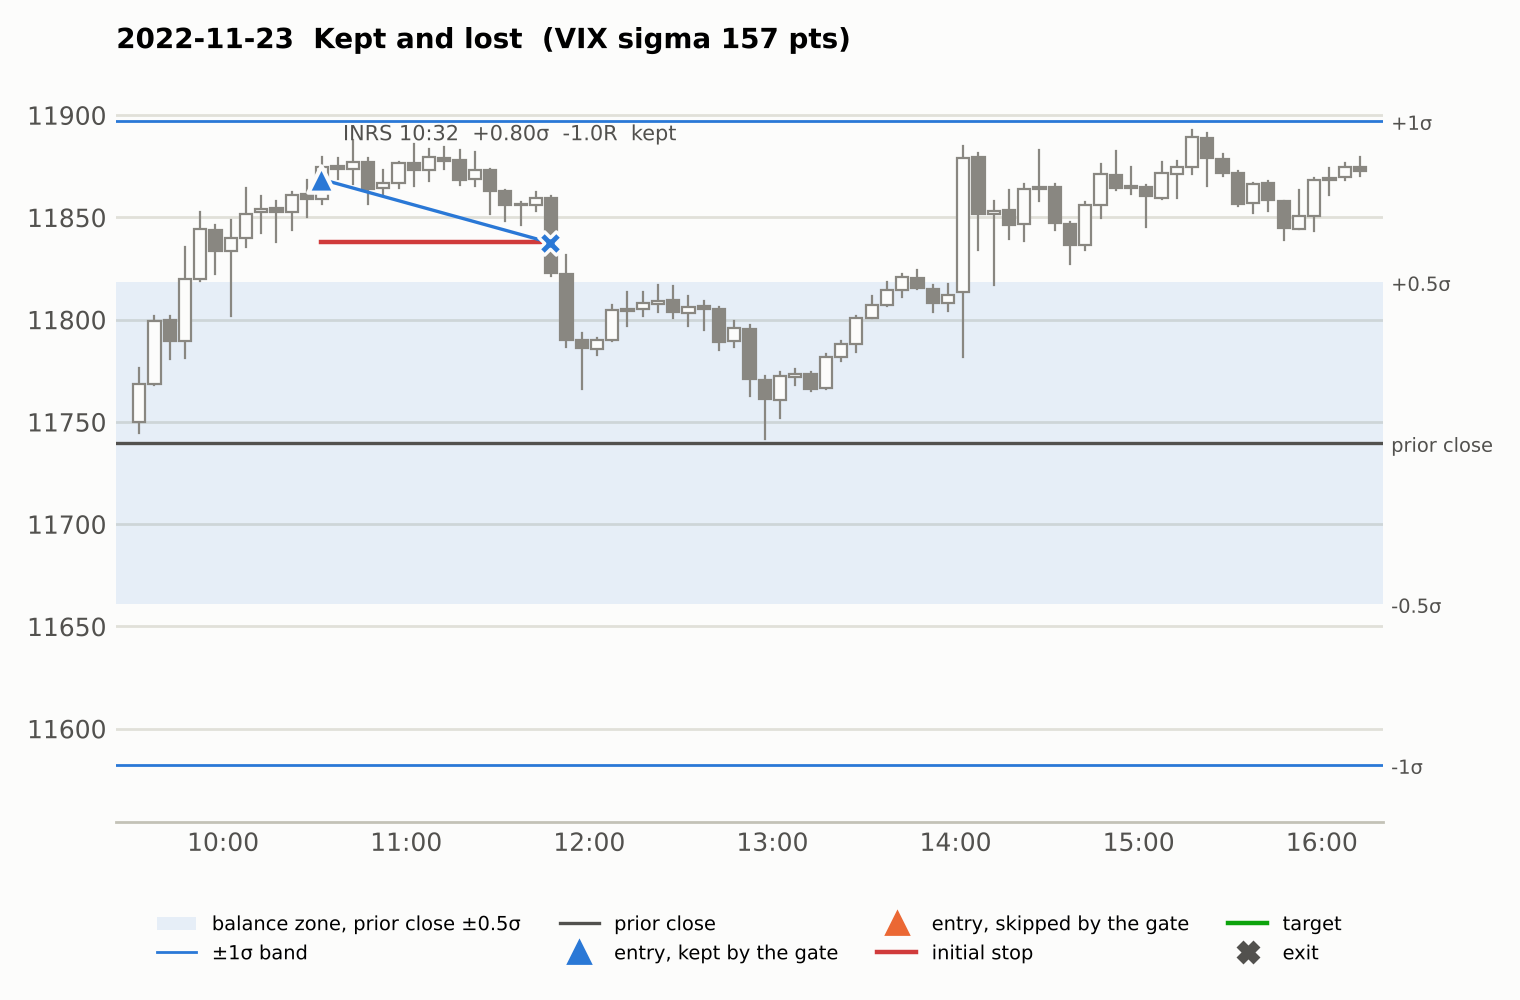
November 23, 2022. The rule is a filter, not a prophecy. A long fired outside the zone at 10:32 and stopped out an hour later as price fell back toward the close. Trades outside the zone still lose two times in three. They work because the winners run past 2R.
Two weeks at a time
Same charts, strung across ten sessions, at $200 of risk a trade in MNQ. The strip underneath is the running net, with every signal in gray for comparison.
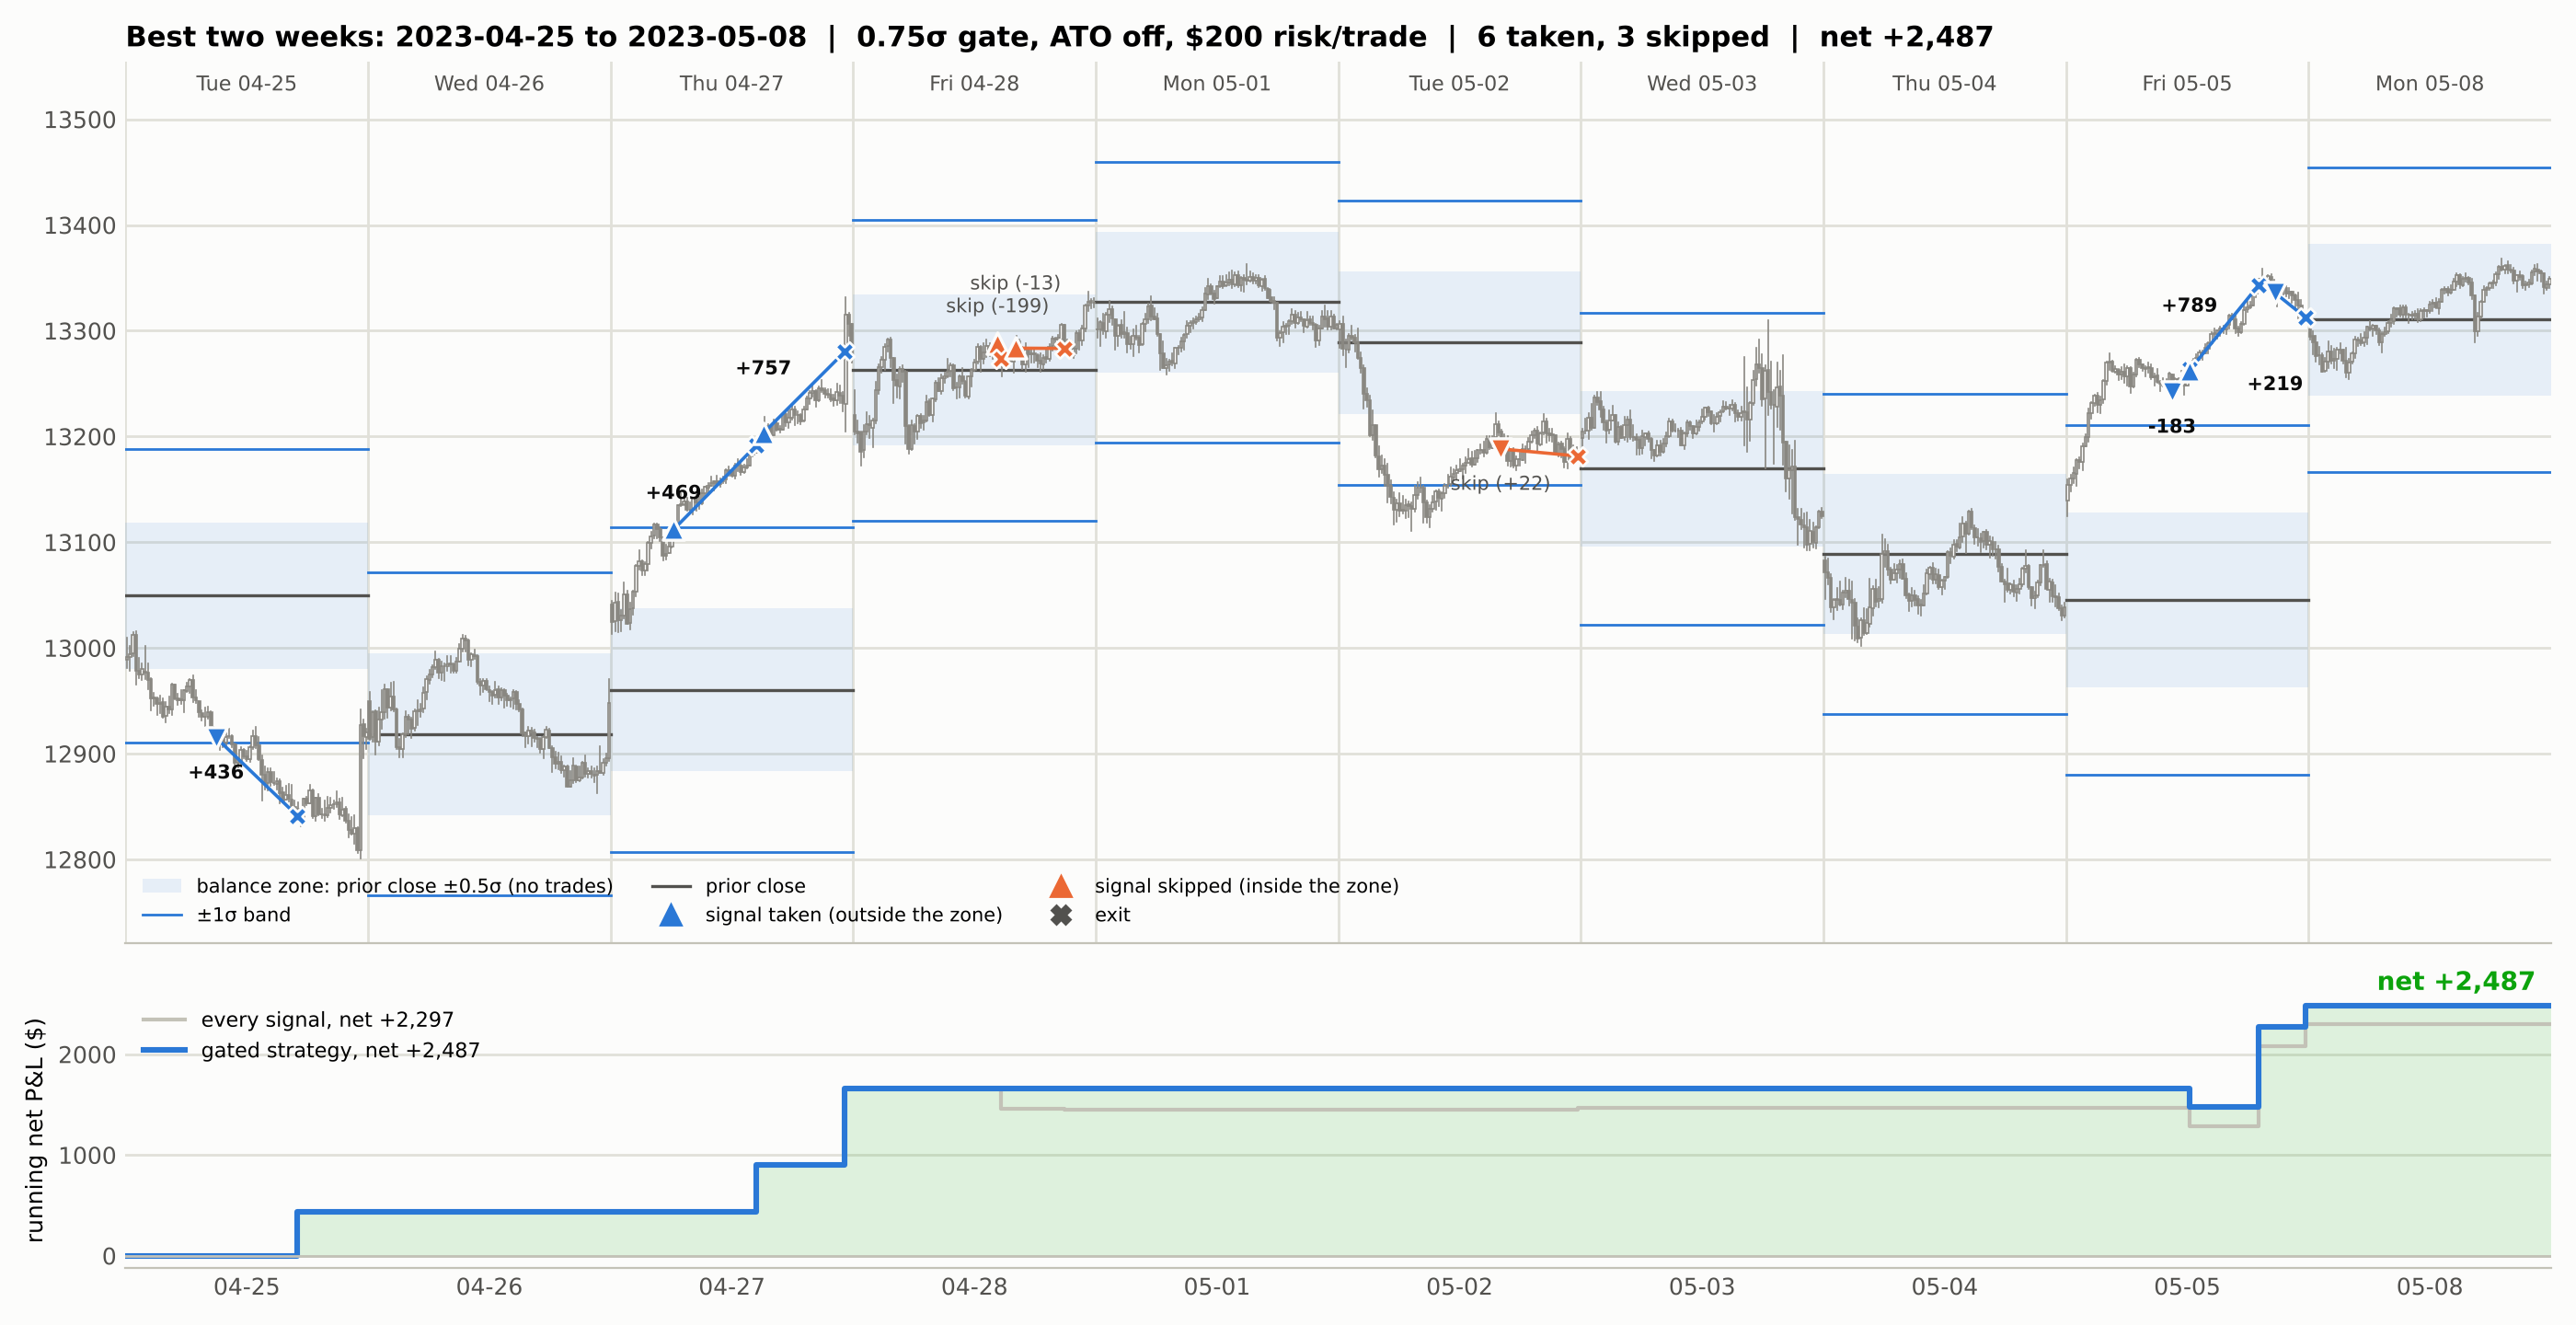
The best two weeks in the record, April 25 to May 8, 2023. Six taken, three skipped, net +$2,487. The skipped ones were all chop around yesterday's close.
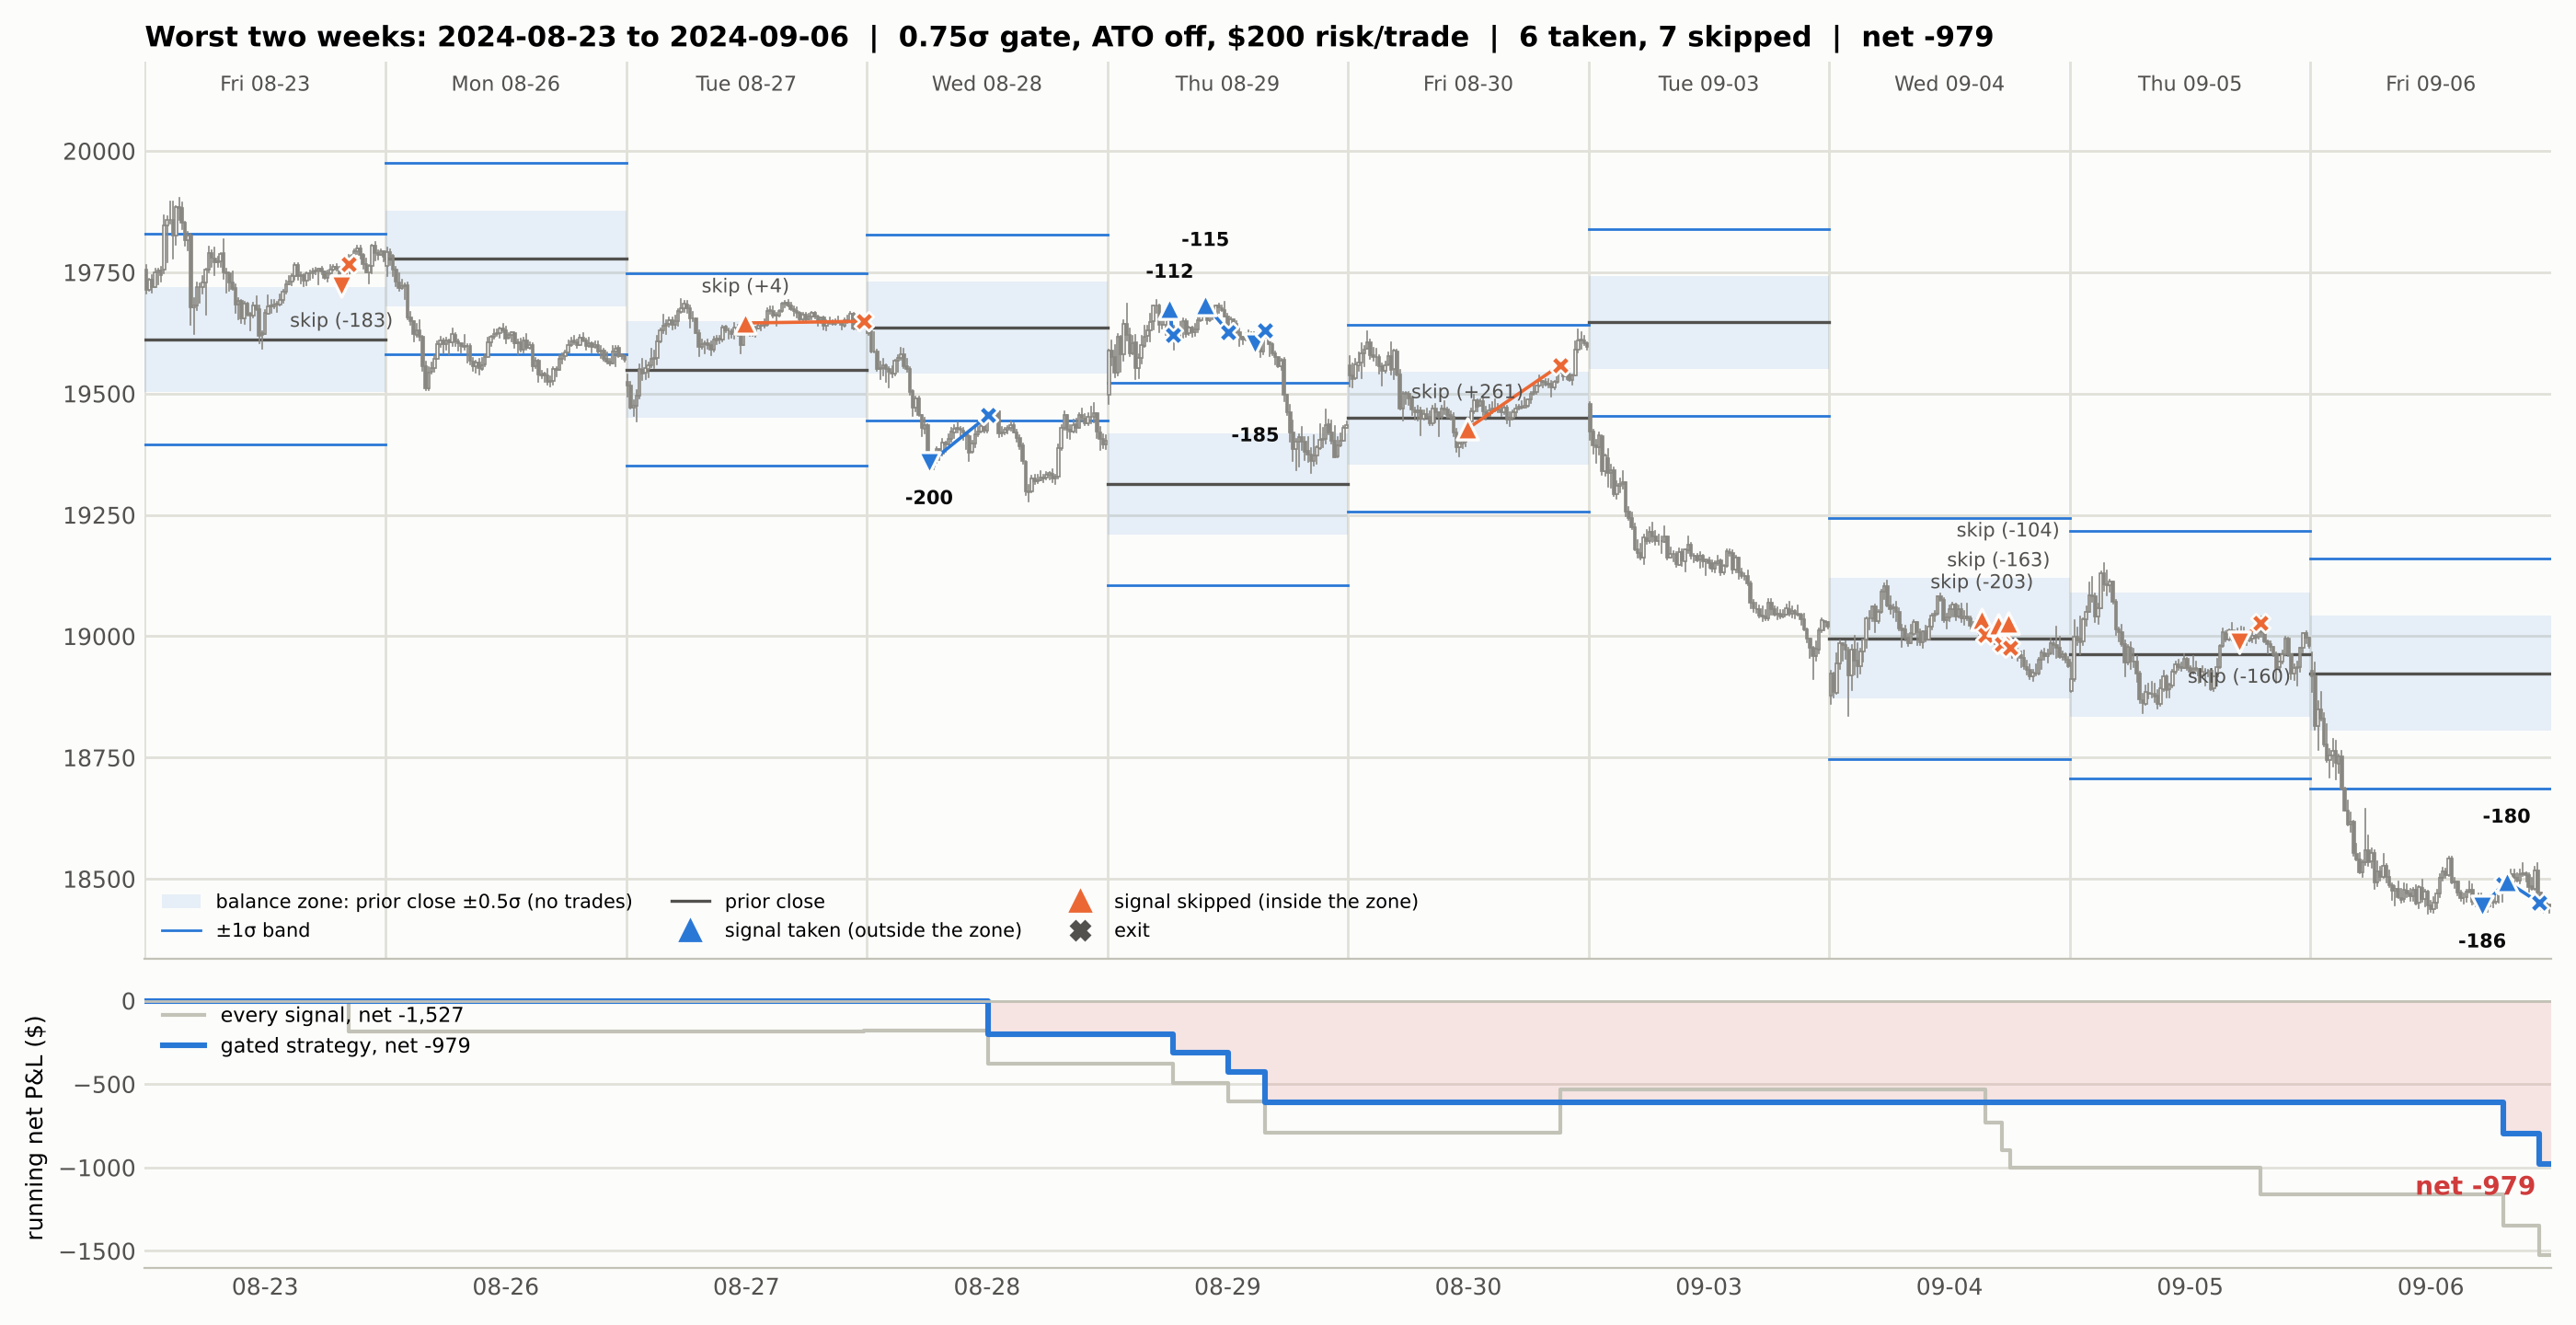
The worst two weeks, August 23 to September 6, 2024. Six taken, seven skipped, net -$979. Taking every signal would have been -$1,527. This is what losing looks like, and it is the stretch to size for.
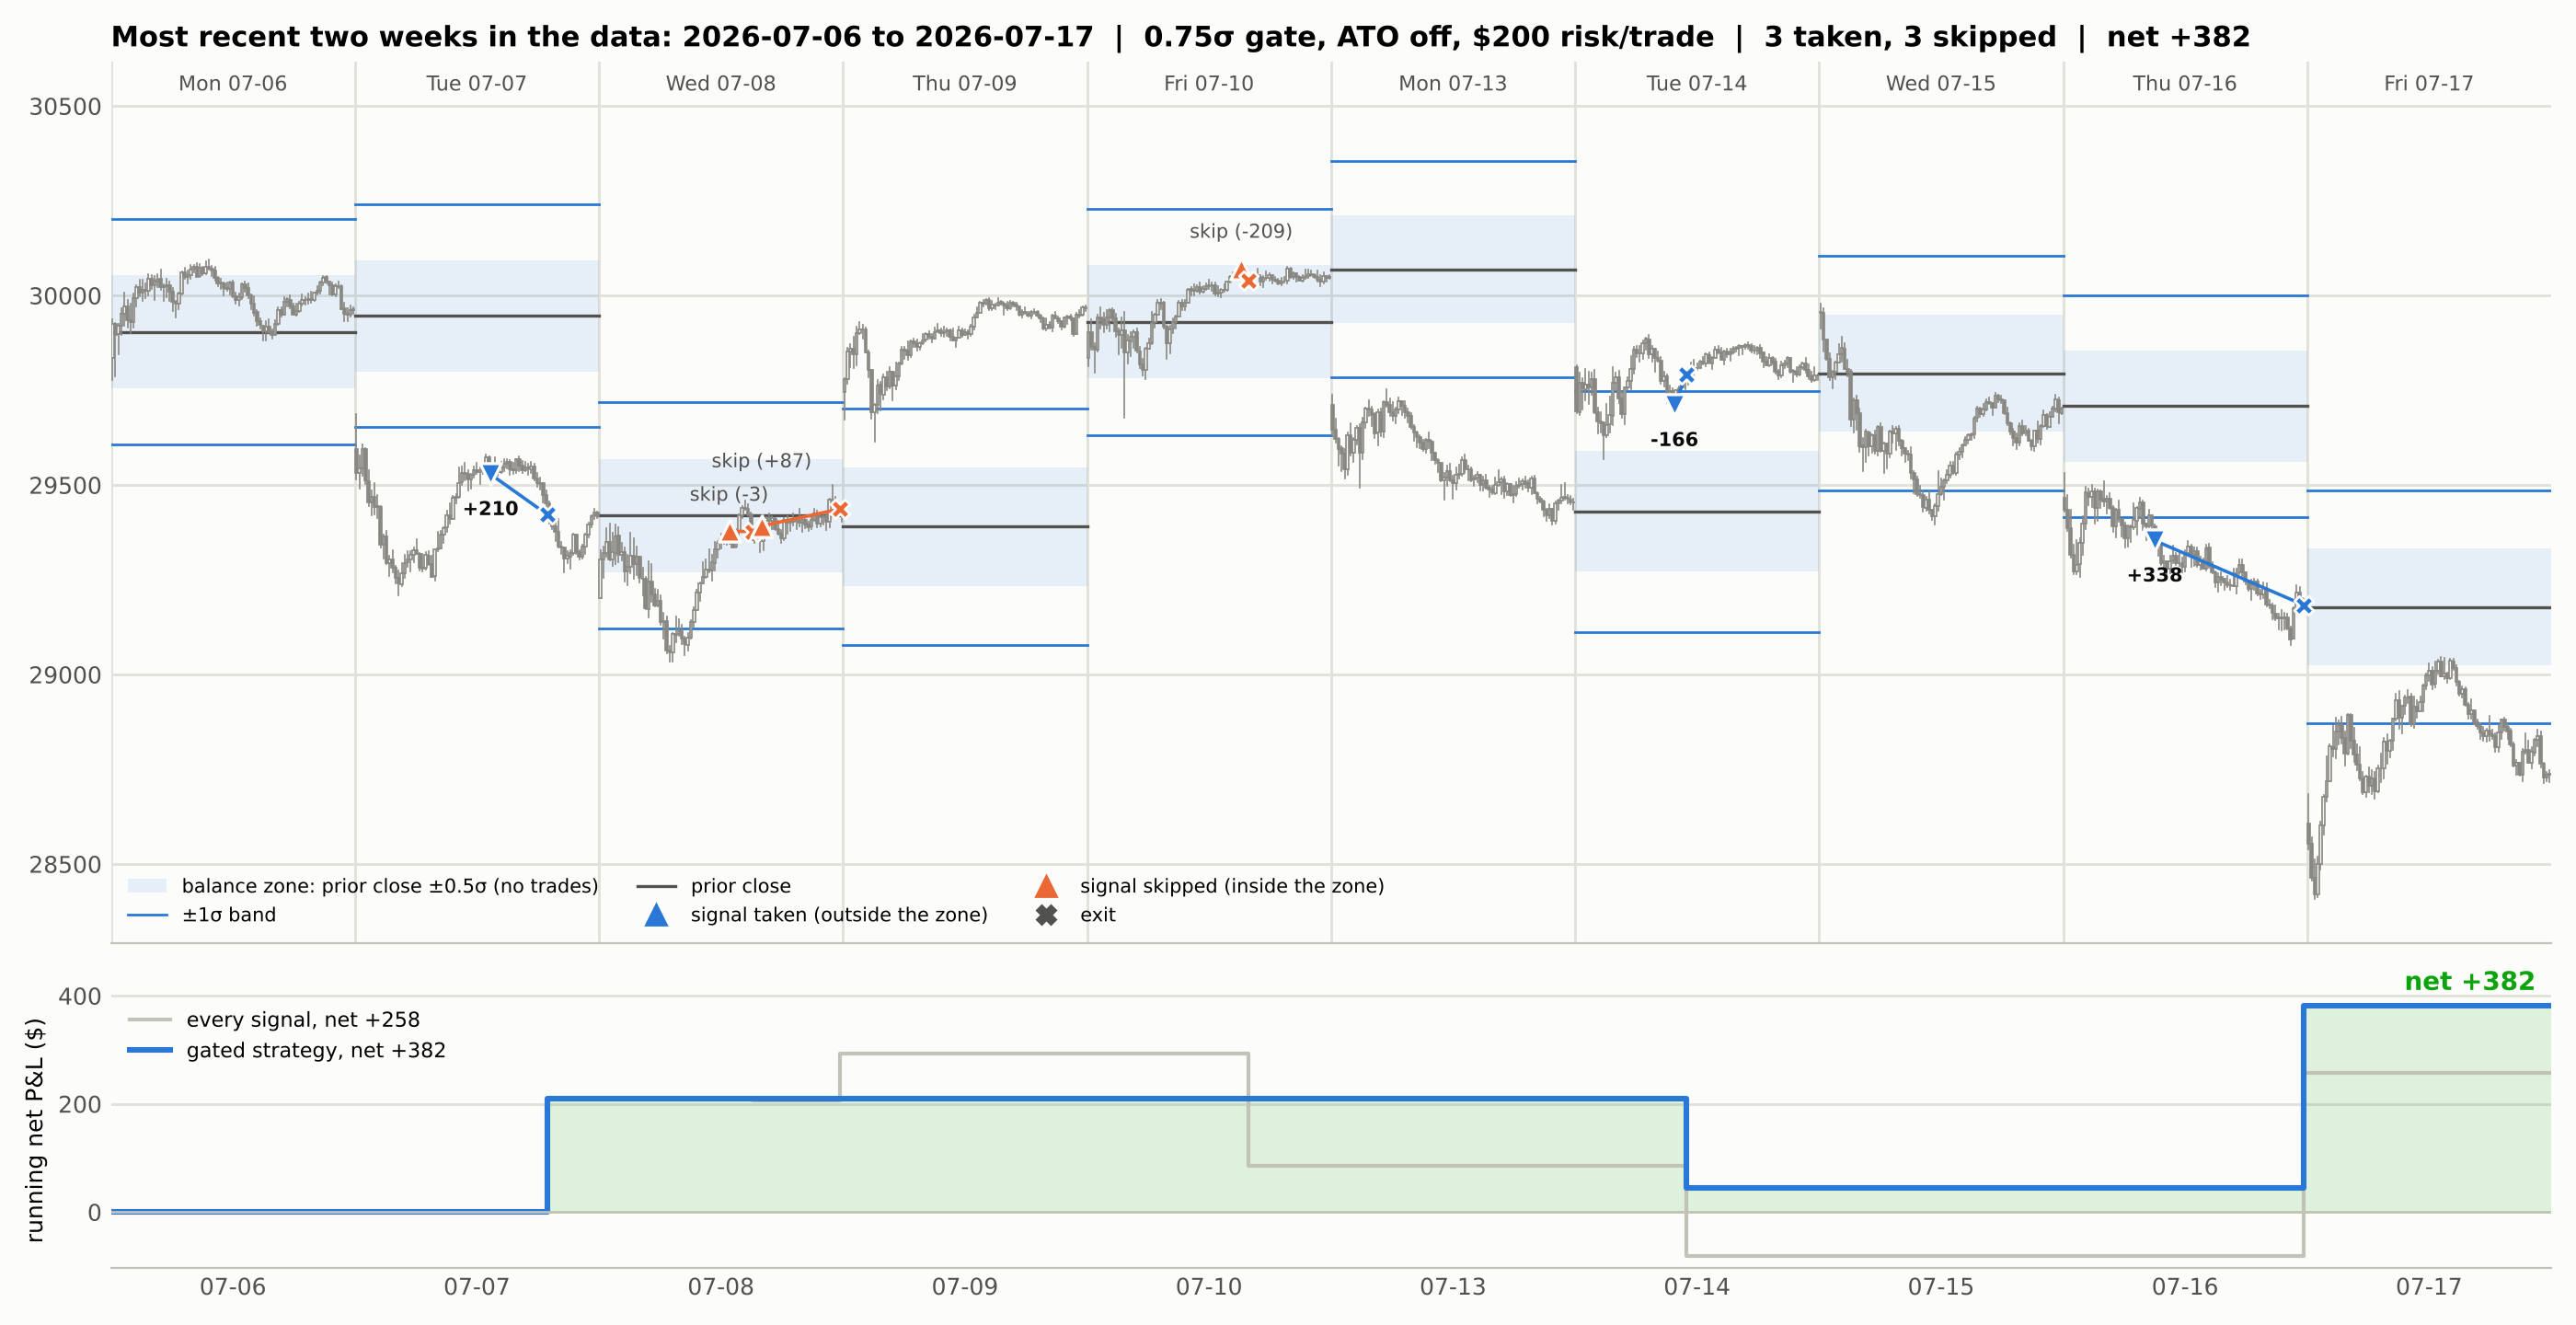
The last two weeks of the five-year record, July 6 to 17, 2026. Three taken, three skipped, net +$382. A typical fortnight.
Why, in one picture
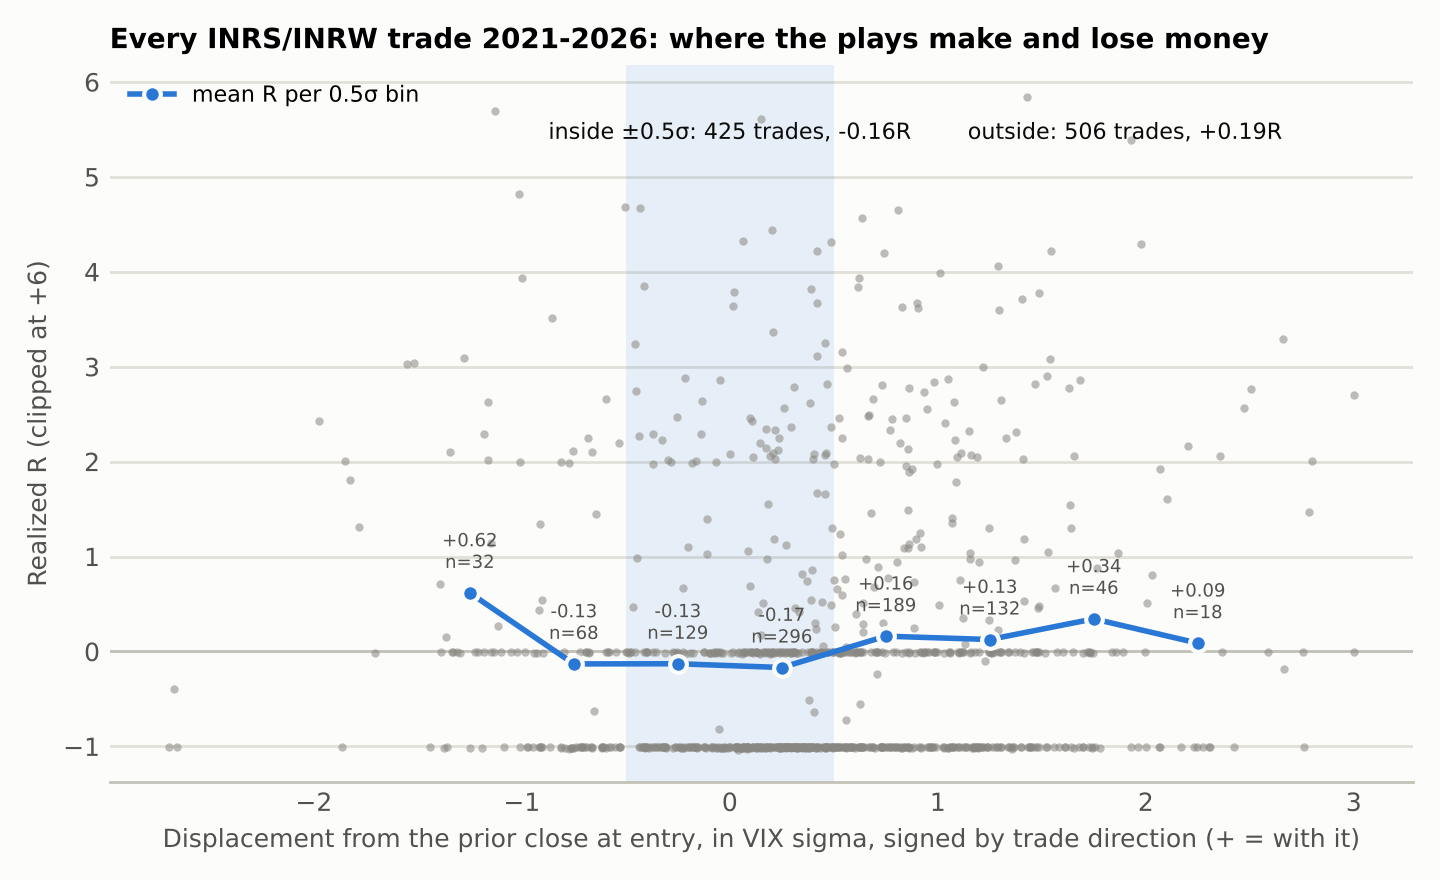
Every one of the 931 level trades since 2021, by how far price was from yesterday's close when it entered, with the trade's direction. The average is negative all the way across the shaded zone and positive on both sides outside it. The plays need the market to have left yesterday's close. Which way it left matters much less.
The starting line and the honest caveats are in I'm changing the test. The running numbers are on the scoreboard.