My strategy fits on a sticky note
One word for direction, two lines on the chart, a hard stop at 11:00, and a backtest that says it breaks even.
Three things go on the note. A direction for the day, long or short. Two prices to watch, the overnight high and low. And the time I stop, 11:00.
I trade NQ, the futures contract on the Nasdaq 100, almost always through MNQ, the micro version. Each MNQ contract moves $2 for every point the index moves. I trade from the 9:30 open until about 11:00 Eastern. Then I close the laptop and go sell software.
The note is older than every tool in this publication. I was waiting for 15-minute higher lows last year, before the prop-firm simulator I built in July 2026, the bot I started in September, or the $2,400 test that began on November 6. The rest of the How I trade series takes each piece of the note up close.
New posts land on Substack first. Free, one a week. The $20k test has a scoreboard, updated every Sunday.
Subscribe on SubstackBias, setup, trigger
Before 9:00 I pick the day's direction from the 4-hour and daily chart. That's the bias, and I only take trades that way. The levels are the overnight high and low, the highest and lowest prices traded between the evening session and the 9:30 open. The trigger is a 15-minute higher low at one of them (a lower high for a short). I enter on the turn, with the stop just under it.
The morning, start to finish
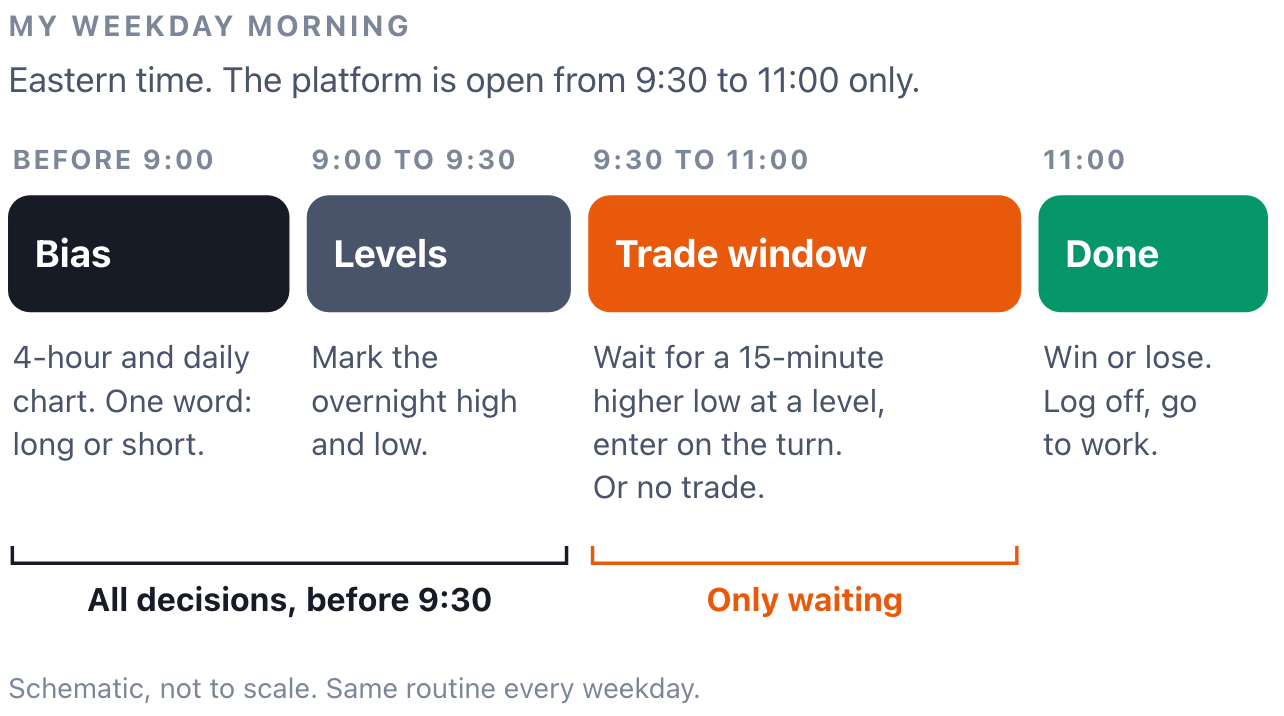
At 11:00 I'm done, win or lose. I only trade 9 to 11 is about why that cutoff works.
A made-up Tuesday
This is an illustration, not a real trade.
The daily chart has made higher highs and higher lows for weeks and the 4-hour agrees, so the bias is long and I write the word down before 9:00. Before the open I mark the overnight high and low. The plan is a long off either line, and shorts don't exist today, however good one looks.
At 9:30 price slides down to the overnight low. A touch of the line isn't an entry, so I wait for a 15-minute candle to show me the turn. Either the next candle holds above the low and closes higher, which is a higher low, and I go long with the stop just under that candle's low. Or price slices straight through and I don't trade at all.
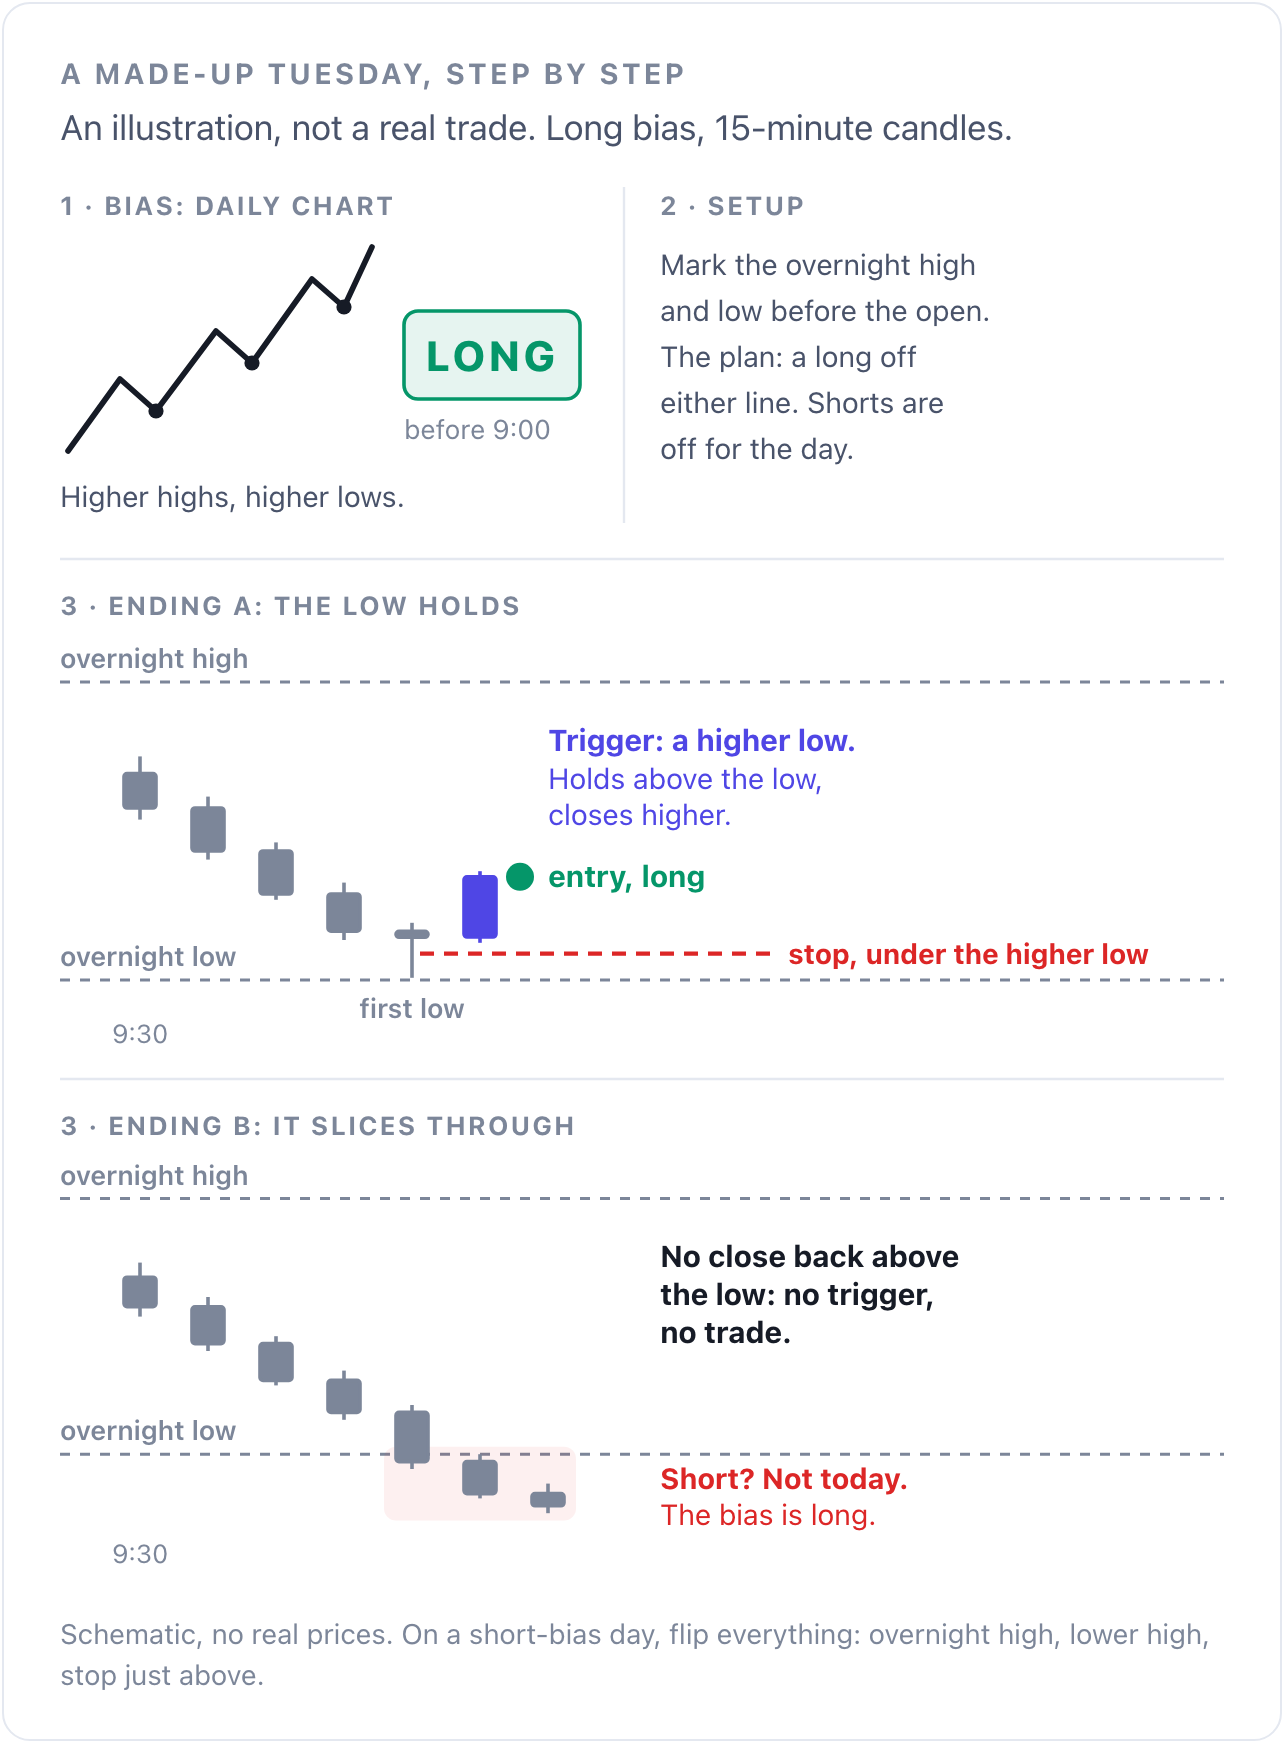
Two of the three steps are finished before the open, and the third can still end in no trade. Wait for the higher low is about that one candle.
Four rules I don't bend
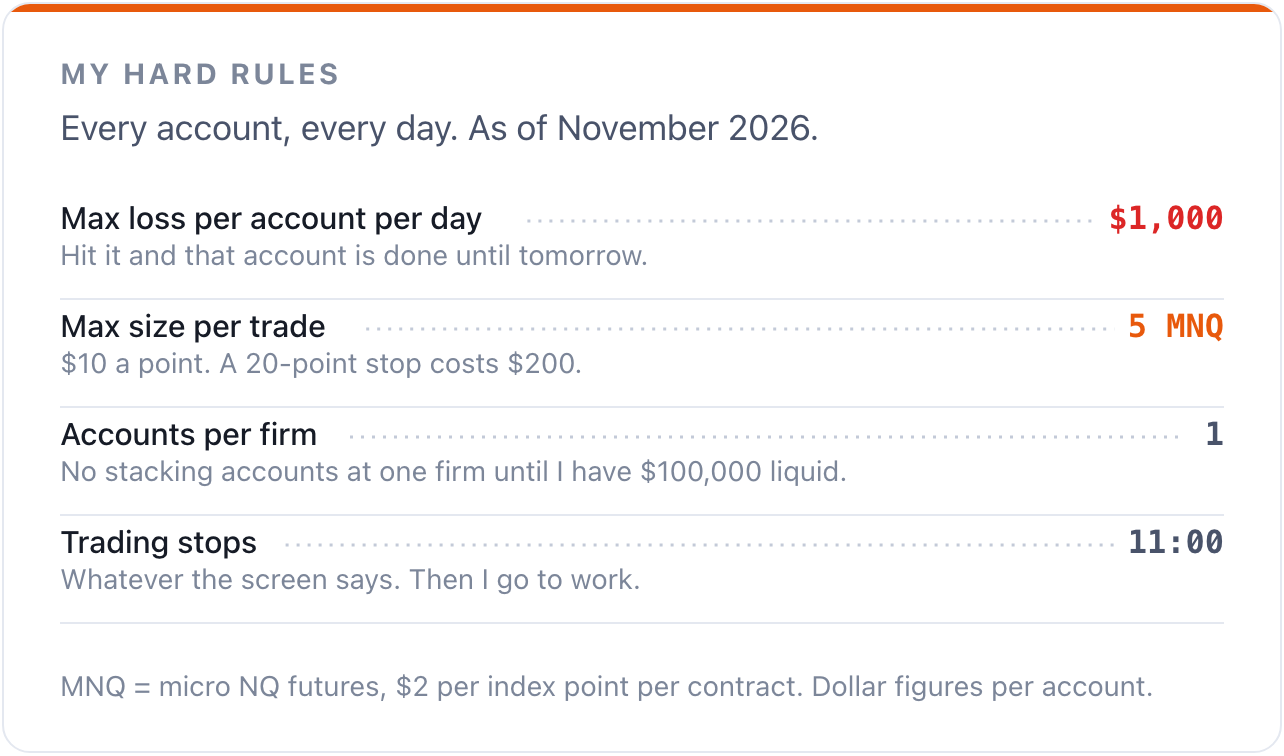
The setup is simple on purpose, so I can follow it on a busy morning. But a simple setup traded too big still blows up an account.
So the rules are about size. At 5 MNQ, a 20-point stop costs $200. Five full losses in a row still only reach the $1,000 daily max, never past it.
The rules that cap my size matter more than the setup, because they decide how bad a bad day can get.
What five years of backtests say
The most honest number I can show you is a test of the setup itself.
I built a TradingView indicator that runs these steps as fixed rules. It runs its checks (the bias, a level, a 15-minute higher low, and a few more) before it calls a setup A+. Then I ran it on five years of MNQ.
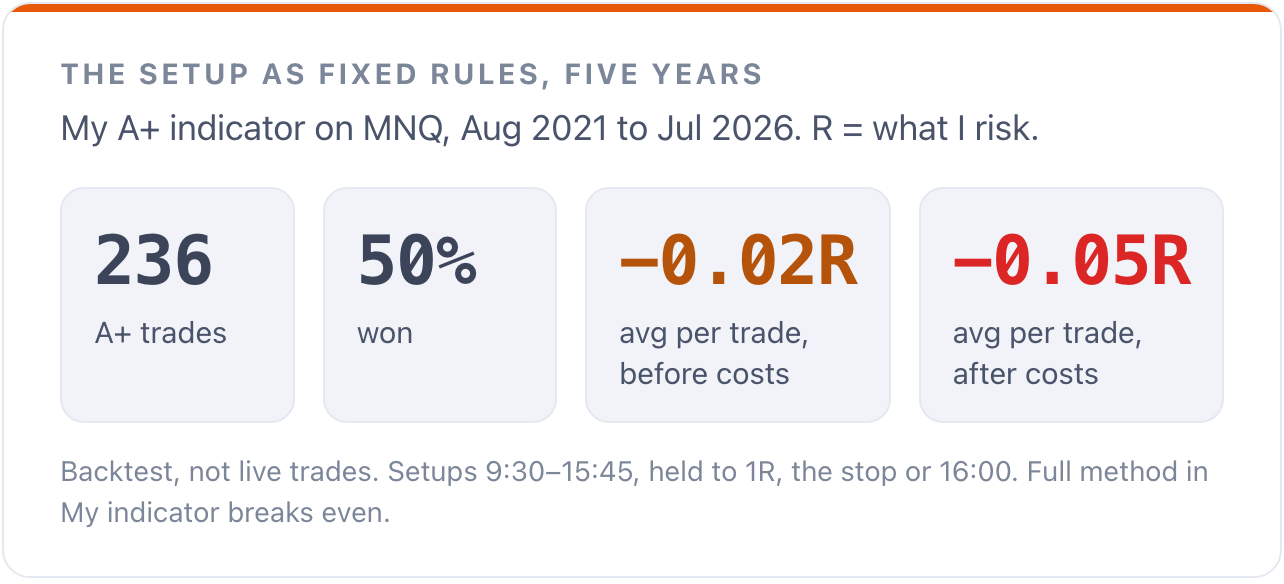
R is what I risk on the trade. An average just under zero R means that, run blind, the setup gives back about what it makes, and costs tip it slightly negative.
It also isn't a test of my morning. The backtest takes setups from 9:30 to 3:45 and holds each one to 1R, the stop or 4:00, and almost all of the 236 A+ trades triggered after 11:00. So it tests the rules all day, not the two hours I trade.
Either way, the rules alone aren't the edge. My indicator breaks even. I gave it $2,400 and 60 days to get better. is where I go looking for one.
What I'll change
The biggest change I've already made is sizing down. Smaller trades made every rule in that table easier to follow.
The next one is a test with a deadline. On November 6 I set aside a $2,400 prop payout and started 60 days of trading the indicator's setups. Every trade goes into my journal the same day. On weekends I test one change at a time against five years of history and the new live trades, and I keep a change only if it holds up on trades it has never seen.
I'll publish the results in early January, good or bad.
Next: I only trade 9 to 11
New posts land on Substack first. Free, one a week. The $20k test has a scoreboard, updated every Sunday.
Subscribe on Substack